Build an Executive Marketing Dashboard with AI Insights

How to Build an Executive Marketing Dashboard with AI
In the realm of business, executives are inundated with data. Yet, the sheer volume often leads to confusion rather than clarity. An effective marketing dashboard can transform this overload into actionable insights, enabling informed decision-making. In this article, I’ll guide you through the process of building an AI-powered executive dashboard, ensuring it aligns with your business objectives and delivers the right insights.
Understanding the Executive Dashboard Landscape
Define What Makes an Executive Dashboard Effective
An effective marketing dashboard is more than just a collection of graphs and charts. It must distill complex datasets into clear, actionable insights. According to a study by the International Data Corporation, 70% of data professionals believe that dashboards should focus on usability rather than just aesthetics. This means prioritizing clarity and functionality over flashy visuals.
A well-designed dashboard should answer key questions at a glance: What are the current performance metrics? Are we on track to meet our goals? What areas require immediate attention? The best dashboards provide a snapshot of the organization’s health, allowing executives to identify trends and make decisions quickly.
Importance of Aligning Dashboards with Business Objectives
Aligning the dashboard with overarching business objectives is critical. If your marketing dashboard doesn’t reflect the goals of your organization, it becomes a futile exercise in data presentation. For instance, if a company’s main goal is to increase customer retention, the dashboard should prominently feature metrics related to customer satisfaction, churn rates, and engagement levels.
To achieve this alignment, involve key stakeholders in the design phase. Their insights will ensure that the dashboard is not only relevant but also tailored to meet the needs of the executives who will use it.
Common Pitfalls in Dashboard Design
Despite the best intentions, many dashboards fall short due to common pitfalls. One such pitfall is information overload. Too much data can overwhelm executives, making it difficult to extract meaningful insights. According to research by the Nielsen Norman Group, users can only process a limited amount of information at one time without becoming confused.
Another frequent issue is the lack of interactivity. Static dashboards that don’t allow users to drill down into the data can limit exploration and understanding. An effective dashboard should offer a degree of interactivity, enabling users to filter, sort, and explore data based on their needs. By avoiding these pitfalls, you can create a dashboard that truly serves its purpose.
Leveraging AI for Dashboard Creation
AI Tools That Simplify Dashboard Creation
AI tools have revolutionized the way we approach marketing dashboard creation. Platforms like Figma’s AI executive dashboard generator enable teams to build custom dashboards quickly and efficiently. These tools can automatically pull in data from various sources, reducing the manual effort involved in dashboard creation.
Moreover, AI can analyze historical data to predict future trends, informing the metrics you choose to display. This predictive capability can be particularly beneficial for understanding market dynamics and customer behavior, allowing executives to make proactive decisions.
Enhancing Data Visualization and Interactivity
AI doesn’t just streamline the creation process; it also enhances data visualization. By utilizing machine learning algorithms, dashboards can adapt to user preferences, presenting data in a way that resonates most with individual executives. For example, some users might prefer bar graphs, while others might find pie charts more intuitive. AI can learn these preferences and adjust visualizations accordingly, improving user engagement.
Additionally, AI can incorporate natural language processing (NLP) to enable conversational interfaces within dashboards. Executives can ask questions in plain language, and the dashboard can respond with relevant data and insights, greatly improving accessibility and usability.
Examples of AI-Generated Dashboards
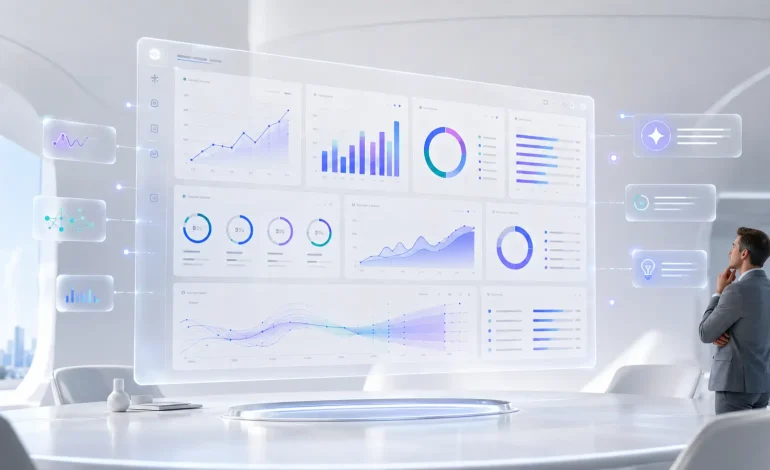
Consider a company utilizing an AI-generated marketing dashboard that integrates various data sources such as social media, website analytics, and customer feedback. This dashboard not only displays key metrics but also provides contextual insights, such as correlating spikes in engagement with specific marketing campaigns. Such a tool empowers executives to make data-driven decisions that align with their strategic vision.
Key Metrics Every Executive Dashboard Should Include
Essential KPIs That Drive Business Growth
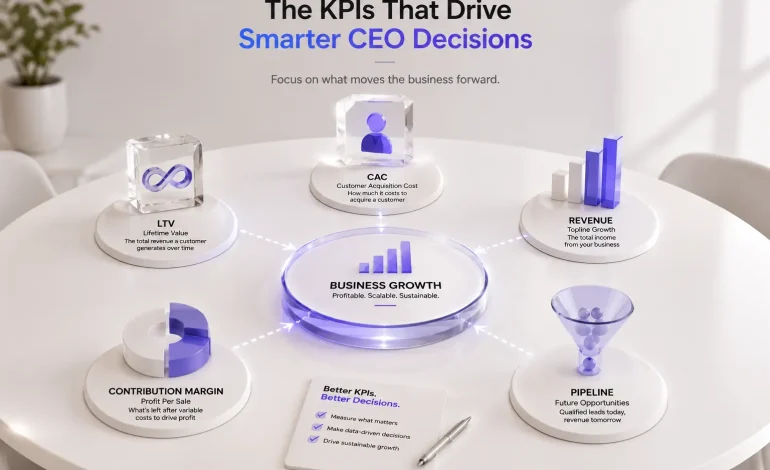
When it comes to KPIs, it’s essential to focus on those that directly influence business growth. Metrics such as customer acquisition cost (CAC), lifetime value (LTV), and conversion rates are fundamental. According to the Marketing Metrics framework, businesses that track these KPIs are significantly more likely to achieve their revenue goals.
For instance, if your CAC is rising while your LTV remains stagnant, it’s a clear signal that your marketing dashboard strategies need reevaluation. Your dashboard should highlight these KPIs prominently, allowing for quick assessments of marketing effectiveness.
Significance of Real-Time Data
The importance of real-time data cannot be overstated. In a fast-paced business environment, decisions must be made quickly. A study by McKinsey shows that organizations leveraging real-time data can outperform their competitors by 23%. This means your executive marketing dashboard should integrate real-time analytics to provide the most current insights available, allowing executives to respond swiftly to changes in the market.
Visualizing Metrics Effectively
Effective visualization is key to understanding metrics. For example, using a combination of heat maps and trend lines can help illustrate customer behavior over time, while bar charts can effectively compare performance across different marketing channels. The goal is to create a dashboard that tells a story, guiding executives through the data in a logical and insightful manner.
Best Practices for Sharing and Utilizing Dashboards
Sharing Dashboards Across Teams
Creating a data-driven culture requires sharing dashboards across teams. When everyone has access to the same insights, it fosters collaboration and informed decision-making. Tools like HubSpot’s AI reporting tools allow for easy sharing and collaboration, enabling different departments to align their strategies based on a unified understanding of performance metrics.
Role of Feedback in Refining Dashboard Design
Feedback is crucial for refining dashboard design and functionality. Regularly solicit input from users to understand what works and what doesn’t. This iterative approach ensures that the dashboard evolves to meet the changing needs of the organization. For example, if users find certain metrics irrelevant, consider replacing them with more applicable data points.
Training Executives to Interpret Dashboard Data
Finally, training is essential. Executives should understand how to interpret the data presented in the dashboard effectively. Consider conducting workshops or one-on-one sessions to familiarize them with the dashboard’s features and the significance of various metrics. A knowledgeable executive can leverage the marketing dashboard to its full potential, ultimately driving better business outcomes.
Case Studies: Successful Executive Dashboards in Action
Real-World Examples of AI-Driven Dashboards
Several companies have successfully implemented AI-driven dashboards to enhance decision-making. For instance, a leading e-commerce company utilized an AI-powered marketing dashboard to integrate customer data from various channels. This not only improved visibility into customer behavior but also enabled the marketing team to tailor campaigns more effectively, resulting in a 15% increase in conversion rates within six months.
Analyzing Outcomes and Improvements
Another case involved a financial services firm that adopted an executive dashboard focusing on real-time risk assessment. By visualizing risk metrics dynamically, executives could respond to emerging risks more swiftly. This proactive approach led to a 30% reduction in response time during market fluctuations, demonstrating the tangible benefits of an AI-enhanced dashboard.
Lessons for Future Dashboard Projects
From these case studies, it’s clear that successful dashboard implementation hinges on aligning metrics with business objectives, leveraging AI for enhanced usability, and fostering a culture of data-driven decision-making. As you embark on your dashboard project, consider these lessons to guide your strategy.
Conclusion
Building an effective executive marketing dashboard requires a thoughtful approach to design, metrics, and usability. By leveraging AI tools and focusing on key performance indicators, you can create a dashboard that transforms data into actionable insights. As you embark on this journey, I encourage you to explore the various AI tools available for creating your executive dashboards and share your experiences. For more resources and insights, consider signing up for my newsletter, where I delve deeper into the intersection of AI and marketing analytics. Your path to data-driven decision-making starts here.